SPACE RACE WITH DATA SCIENCE (IBM FINAL PROJECT)

GOAL

RESULT

PROJECT DURATION

The main objective of this project is to create a machine learning model that can forecast whether the first stage of SpaceX Falcon 9 rockets will land successfully. This forecast is essential for projecting launch costs and offers useful information to businesses in the space launch industry.


The project’s findings showed that launch success rates have increased from 2013 to 2020 and that a launch site’s flight count corresponds with its success rate. Certain orbits showed higher success rates; the most successful launch location was KSC LC-39A. In terms of landing prediction, the decision tree classifier turned out to be the most successful.

The project, which included data collecting, cleaning, analysis, and visualization, took around a week to complete.

CASE – SPACEX FALCON 9 LANDING PREDICTION CASE

This project is currently accessible to anyone interested in data science or the learning process who is looking for references. It is a part of the IBM Data Science Certification Program. This paper provides an overview of the various stages that a data scientist goes through to extract knowledge and explain their findings. The following link will take you to the complete report.

https://github.com/hberksafak/IBM_Final_Project


Executive Summary

Summary of methodologies:

•Data Collection via API, SQL and Web Scrapping

• Data Wrangling and Analysis

• Interactive Maps with Folium

• Predictive Analysis

• Machine Learning Prediction

Summary of all results:

• Explotary Data Analysis along with Interactive Visualizations

• Predictive Analysis

Introduction

Project background and context: Space X promotes the launch of Falcon 9 rockets on its website for 62 million dollars, which is considerably less expensive than other providers who charge at least 165 million dollars per launch. The major reason for this price difference is that Space X can recycle the first stage. Thus, it is possible to estimate the cost of a launch if we can predict whether the first stage will land. 
This knowledge can be advantageous for another company that wishes to 
compete with Space X for a rocket launch contract. The objective of this 
project is to establish a machine learning process to anticipate the success of the first stage landing.
Problems you want to find answers:
The aim of the project is to forecast whether the initial stage of the SpaceX 
Falcon 9 rocket will accomplish a successful landing.

SECTION 1 — METHODOLOGY

Data collection methodology:
• From SpaceX Rest API
• Web Scrapping
Perform data wrangling:
• Encoding data fields for machine learning and dropping irrelevant columns
Perform exploratory data analysis (EDA) using visualization and SQL
Perform interactive visual analytics using Folium and Plotly Dash
Perform predictive analysis using classification models

• Building and evaluating classification models

DATA COLLECTION

The data about SpaceX launches can be obtained from the SpaceX REST API. This API provides information about the rocket used, payload delivered, launch specifications, landing specifications, and landing outcome in JSON format
Then cleaned the data, checked for missing values and fill in missing values where necessary.
An additional frequently used method for acquiring Falcon 9 launch information is web scraping Wikipedia by utilizing the BeautifulSoup tool. The data is extracted from Wikipedia and is saved in a CSV file through the process of web scraping.


Data Collection — SpaceX API

The link to the notebook is;

https://github.com/hberksafak/IBM_Final_Project/blob/master/Data%20Collection%20API.ipynb

Requesting Rocket Launch Data from Spacex API

Let’s start requesting rocket launch data from SpaceX API

Decode the response content as a Json

Data Collection — Scraping

Data Wrangling

Analyzed the data through exploratory techniques to identify the training labels.

Computed the count of launches per site and the frequency of each orbit. 

Converted the outcome column to a landing outcome label and saved the findings in a CSV file.

EDA with Data Visualization

Examined the data by creating visual representations that show the correlation between flight number and launch site, payload and launch site, success rate for each type of orbit, flight number and orbit type, and the annual trend for launch success.


EDA with SQL

• The first query involved displaying the names of unique launch sites used in space missions.

• Another query displayed five records where the launch sites began with the string ‘KSC.’ 

• The third query displayed the total payload mass carried by boosters launched by NASA (CRS). 

• The fourth query displayed the average payload mass carried by the booster version F9 v1.1. 

• The fifth query involved listing the date when a successful landing outcome was achieved on a drone ship. 

• The sixth query listed the names of boosters that had successful landings on ground pads and had payload mass greater than 4000 but less than 6000. 

• The seventh query listed the total number of successful and failure mission outcomes. 

• The eighth query listed the names of booster versions that carried the maximum payload mass. 

• The ninth query displayed records showing the month names, successful landing outcomes in ground pad, booster versions, and launch sites for the months in the year 2017. 

• Finally, the last query ranked the count of successful landing outcomes between the dates June 4th, 2010, and March 20th, 2017, in descending order.


The launch sites were identified and mapped out on Folium, with various map objects, such as markers, circles, and lines, used to indicate the success or failure of launches for each site.

Predictive Analysis (Classification)

The data was loaded using NumPy and Pandas, followed by data transformation and splitting into training and testing sets. Various machine learning models were built, and different hyperparameters were fine-tuned using GridSearchCV. Accuracy was used as the evaluation metric for the models, and feature engineering and algorithm tuning were employed to improve the model performance. The best classification model was determined after all the optimization steps.

The link to the notebook is;

https://github.com/hberksafak/IBM_Final_Project/blob/master/Machine%20Learning%20Prediction.ipynb


SECTION 2 — INSIGHTS DRAWN FROM EDA

Flight Number vs. Launch Site

Based on the plot, it can be observed that there is a positive correlation between the number of flights conducted at a launch site and the success rate of the launches. In other words, the higher the flight count at a particular launch site, the more likely it is for the launches to succeed.

Payload vs. Launch Site

The number of launches from the CCAFS SLC 40 site is notably higher than those from other launch sites.

Success Rate vs. Orbit Type

From the plot; we can see that ES_L1, GEO, HEO, SSO, VLEO had the most succes rate

Flight Number vs. Orbit Type

The following plot depicts the relationship between Flight Number and Orbit type.

From the plot, it can be inferred that success in LEO orbit is positively correlated with the number of flights. However, in the case of GTO orbit, there appears to be no relationship between flight number and the orbit.

Payload vs. Orbit Type

It can be observed that for payloads with a heavy weight, the probability of a successful landing is higher for orbits such as PO, LEO, and ISS

Launch Success Yearly Trend

Based on the plot, it is evident that the success rate of launches has been consistently increasing since 2013 and has continued to rise until 2020.

All Launch Site Names

To display only distinct launch sites from the SpaceX data, we used the keyword DISTINCT.

Launch Site Names Begin with ‘CCA’

%sql select * from SPACEXTBL where LAUNCH_SITE like 'CCA%' limit 5

Total Payload Mass

%sql select sum(PAYLOAD_MASS_KG) from SPACEXTBL where CUSTOMER = 'NASA (CRS)'

Average Payload Mass by F9 v1.1

%sql select avg(PAYLOAD_MASS_KG) from SPACEXTBL where BOOSTER_VERSION = ‘F9 v1.1’

%sql select avg(PAYLOAD_MASS_KG) from SPACEXTBL where BOOSTER_VERSION = 'F9 v1.1'

First Successful Ground Landing Date

%sql select min(DATE) from SPACEXTBL where Landing_Outcome = 'Success (ground pad)'

Successful Drone Ship Landing with Payload between 4000 and 6000

%sql select BOOSTER_VERSION from SPACEXTBL where Landing__Outcome = 'Success (drone ship)' and PAYLOAD_MASS_KG_ > 4000 and PAYLOAD_MASS__KG_ < 6000

Total number of Successful and Failure Mission Outcomes

%sql select count(MISSION_OUTCOME) from SPACEXTBL where MISSION_OUTCOME = 'Success' or MISSION_OUTCOME = 'Failure (in flight)'

Boosters Carried Maximum Payload

%sql select BOOSTER_VERSION from SPACEXTBL where PAYLOAD_MASS__KG_ = (select max(PAYLOAD_MASS_KG_) from SPACEXTBL)

2015 Launch Records

%sql select * from SPACEXTBL where Landing__Outcome like 'Success%' and (DATE between '2015–01–01' and '2015–12–31') order by date desc

Rank Landing Outcomes Between 2010–06–04 and 2017–03–20

%sql select * from SPACEXTBL where Landing__Outcome like 'Success%' and (DATE between '2010–06–04' and '2017–03–20') order by date desc

SECTION 3 — LAUNCH SITES PROXIMITIES ANALYSIS

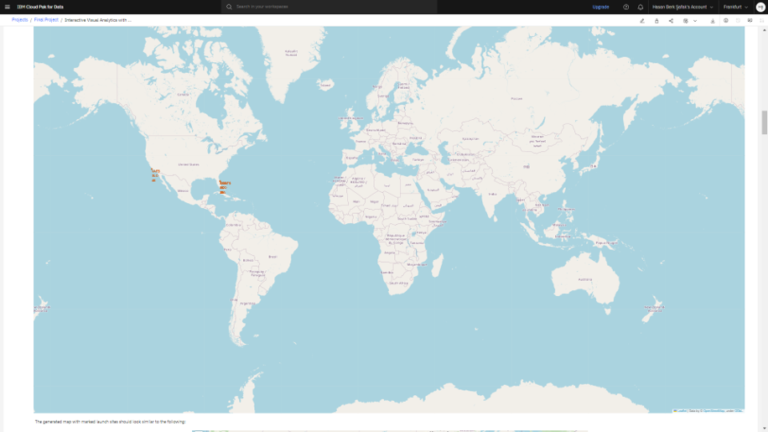
Folium Map

SpaceX launch sites are in the USA coasts

Markers showing launch sites with color labels

Green marker shows succesful launches, red marker shows failures

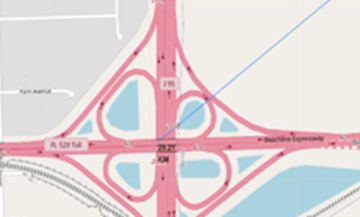
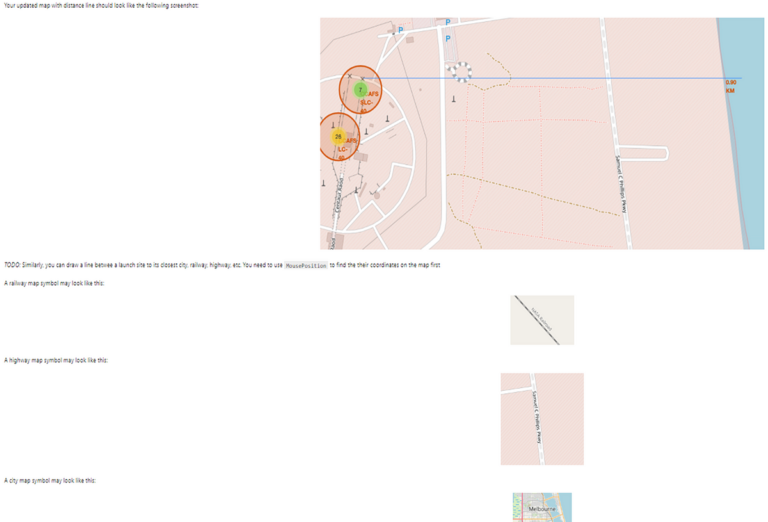
Launch Site distance to landmarks


-Are launch sites close to railways? 

-No

-Are launch sites close to highways?

-No

-Are launch sites close to coastlines?

-Yes

SECTION 4 — PREDICTIVE ANALYSIS (CLASSIFICATION)

Classification Accuracy

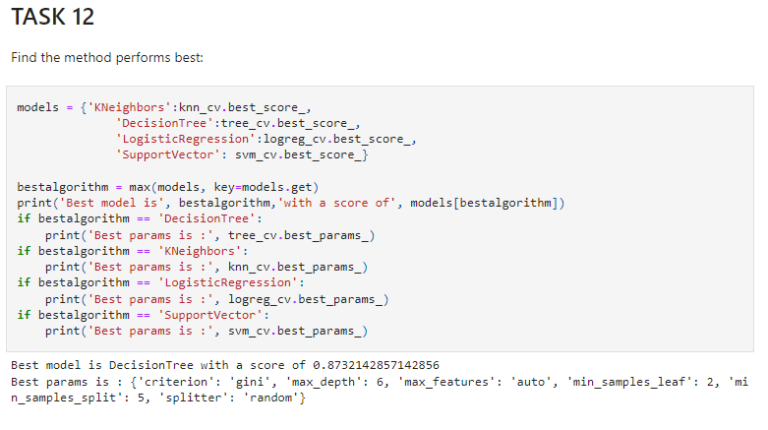
Out of all the models, the decision tree classifier has the highest accuracy in classification.

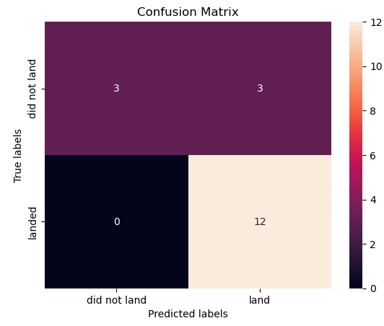
Confusion Matrix

The decision tree classifier’s confusion matrix indicates that it is capable of differentiating between the various classes. However, the primary issue lies with false positives, where the classifier mistakenly identifies unsuccessful landings as successful ones.

Conclusions

There is a positive correlation between flight amount and success rate at a launch site, meaning that the more flights conducted at a launch site, the higher the success rate tends to be.

The launch success rate has been increasing since 2013 and continued until 2020, indicating a positive trend in launch success.

Orbits ES-L1, GEO, HEO, SSO, and VLEO have shown the highest success rates, suggesting that these orbits are more feasible for successful launches.

KSC LC-39A is the launch site with the highest number of successful launches.

The decision tree classifier appears to be the best-suited machine learning algorithm for this task based on the given information.

You can access my full project from my GitHub profile;

GitHub
hberksafak's Blue Github Chart
Tableau
Kaggle
© | 2023 by Hasan Berk Şafak