Regional Analysis of Ingredients Consumption in the Agriculture Industry
GOAL
RESULT
PROJECT DURATION
Improve marketing strategies by segmenting plant protection products and pesticides based on regional needs.
A detailed market analysis, visualized through Tableau, illuminating agricultural trends, regional preferences, and product demands.
The estimated duration of the project is 5 to 6 months, depending on the availability, completeness, and cleanliness of the data.
CASE – Market segmentation analysis of the contents of plant protection products and pesticides
Our aim in this project is to understand our customers better and improve our marketing strategies by performing market segmentation analysis of the contents of plant protection products and pesticides. At the same time, understanding which region needs what type of content.
We will analyze and visualize data from our database’s “customers,” “address,” “orders,” and “item” tables using Tableau.
Market segmentation analysis includes analysis of fertilizer and pesticide contents during the summer period. The study will be divided into 3 different agricultural cities in Turkey and different sales areas within the cities, based on the ratios of the most consumed materials per 100 liters and where they are consumed more.

The data that I’ve collected were the result of my experience as a Marketing Research Analyst at an Agricultural Industry where I worked for two years in Turkey. I’ve gathered these imaginary data by leveraging my regional and industrial knowledge and by consistently placing product orders from fictitious customers.
Project Objectives:
- Analyze agricultural market trends, regional preferences, and product demand.
- Identify the key ingredients needed for different agricultural territories.
- Create targeted product recommendations based on regional requirements.
- Develop marketing strategies to promote our products effectively.
Step 1: Data Extraction
Extract relevant customer location, product orders, and ingredients from the customer database, order history, and product details.
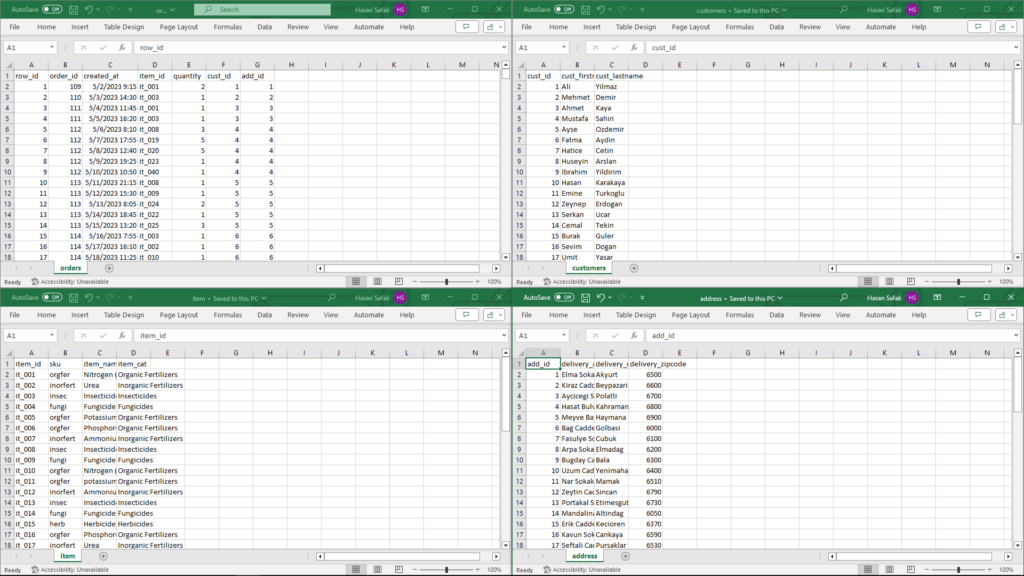
We will create a database using four different Excel sheets.

Address Table:
address_id: This field serves as a unique identifier for each address. delivery_city: Records the city where the delivery address is located. delivery_zip_code: Contains the ZIP or postal code associated with the delivery address.
Purpose: The Address table stores location-related information, allowing you to associate delivery addresses with customers and orders. It helps in mapping orders to specific geographic regions.
Customers Table:
customer_id: A unique identifier for each customer.
customer_first_name: Stores the first name of each customer. customer_last_name: Records the last name of each customer.
Purpose: The Customers table contains customer-specific information, enabling you to identify and profile individual customers. It serves as a key reference point for customer-related data.
Item Table:
item_id: A unique identifier for each item.
sku: Represents the Stock Keeping Unit, a unique code assigned to each item for inventory management.
item_name: Contains the name or description of the item.
item_category: Categorizes items into specific groups (e.g., fertilizer, pesticides).
Purpose: The Item table stores detailed information about the products you offer, including their names, categories, and ingredients. It is essential for managing your product catalog and inventory.
Orders Table:
row_id: A unique identifier for each row in the Orders table.
order_id: A unique identifier for each order.
created_at: Captures the timestamp or date when the order was created. quantity: Specifies the quantity of each item included in the order. customer_id: Links each order to a specific customer using the customer’s unique identifier from the others.
Purpose: The Orders table is essential for tracking orders, managing inventory, analyzing customer behavior.
Step 2: Data Cleaning and Preparation
After extracting the data from the Excel sheets and converting them to CSV files, the next crucial step is to ensure that our data is in the best shape for analysis.
We’ve attentively checked our data to ensure it maintains integrity. We looked for missing values, inconsistencies, or duplicate entries in each table. For instance, in the “address” table, we ensured that there are no missing or duplicate address IDs, city names, or ZIP codes. In the “customers” table, we verified that each customer has a unique ID.
We’ve also cleaned up any inconsistencies in our data. For example, in the “item” table, we ensured that item categories are consistent and that product names and descriptions are standardized.
There were some data transformations required. For example, calculating ratios of ingredients per 100 liters of product was essential for understanding product demand, so we’ve added that to our dataset.
We checked the relationships between our tables to ensure they are accurately established. In our project, we verified that the customer IDs in the “orders” table match the IDs in the “customers” table.
We have documented all data cleaning and preparation steps for future reference and sharing with team members.
After creating, cleaning, and preparing all Excel files, we will import them into MySQL Workbench to establish relations with SQL.
Let’s begin by creating the necessary tables for MySQL usage.
-- Select the "agridb" database
USE agridb;

-- Create the "address" table
CREATE TABLE `address` (
    `add_id` int NOT NULL,
    `delivery_address1` varchar(200) NOT NULL,
    `delivery_city` varchar(50) NOT NULL,
    `delivery_zipcode` varchar(20) NOT NULL,
    PRIMARY KEY (`add_id`)
);

-- Create the "customers" table
CREATE TABLE `customers` (
    `cust_id` int NOT NULL,
    `cust_firstname` varchar(50) NOT NULL,
    `cust_lastname` varchar(50) NOT NULL,
    PRIMARY KEY (`cust_id`)
);

-- Create the "item" table
CREATE TABLE `item` (
    `item_id` varchar(10) NOT NULL,
    `sku` varchar(20) NOT NULL,
    `item_name` varchar(100) NOT NULL,
    `item_cat` varchar(100) NOT NULL,
    `item_size` varchar(10) NOT NULL,
    `item_price` decimal(10,2) NOT NULL,
    PRIMARY KEY (`item_id`)
);

-- Create the "orders" table
CREATE TABLE `orders` (
    `row_id` int NOT NULL,
    `order_id` varchar(10) NOT NULL,
    `created_at` datetime NOT NULL,
    `item_id` varchar(10) NOT NULL,
    `quantity` int NOT NULL,
    `cust_id` int NOT NULL,
    `delivery` boolean NOT NULL,
    `add_id` int NOT NULL,
    PRIMARY KEY (`row_id`)
);
After creating tables, we should merge these tables.
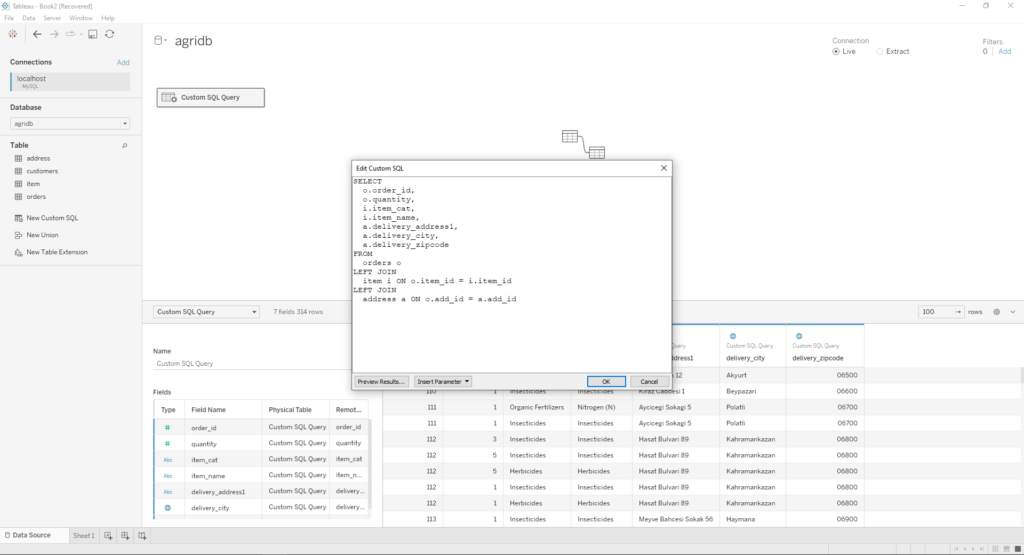
This SQL code extracts order information including associated items and delivery addresses from a relational database using LEFT JOINs to combine data from different tables and handle missing data.
SELECT
  o.order_id,
  o.quantity,
  i.item_cat,
  i.item_name,
  a.delivery_address1,
  a.delivery_city,
  a.delivery_zipcode
FROM
  orders o
LEFT JOIN
  item i ON o.item_id = i.item_id
LEFT JOIN
  address a ON o.add_id = a.add_id
When querying databases, it’s common to use table aliases for shorter names. In this case, o stands for the orders table, i stands for the item table, and a stands for the address table.
To join tables together, LEFT JOIN clauses are used. With LEFT JOIN, all records from the left table (orders table) are retrieved along with the matched records from the right table (item and address tables). If there is no match in the right table, NULL values will be returned.
ON clauses define the join conditions between the tables. For example, o.item_id = i.item_id specifies that the item_id column in the orders table should be matched with the item_id column in the item table. Similarly, o.add_id = a.add_id specifies that the add_id column in the orders table should be matched with the add_id column in the address table.
We will use this special SQL query to connect and visualize the relational database in tableau;

Step 3: Data Analysis with Tableau
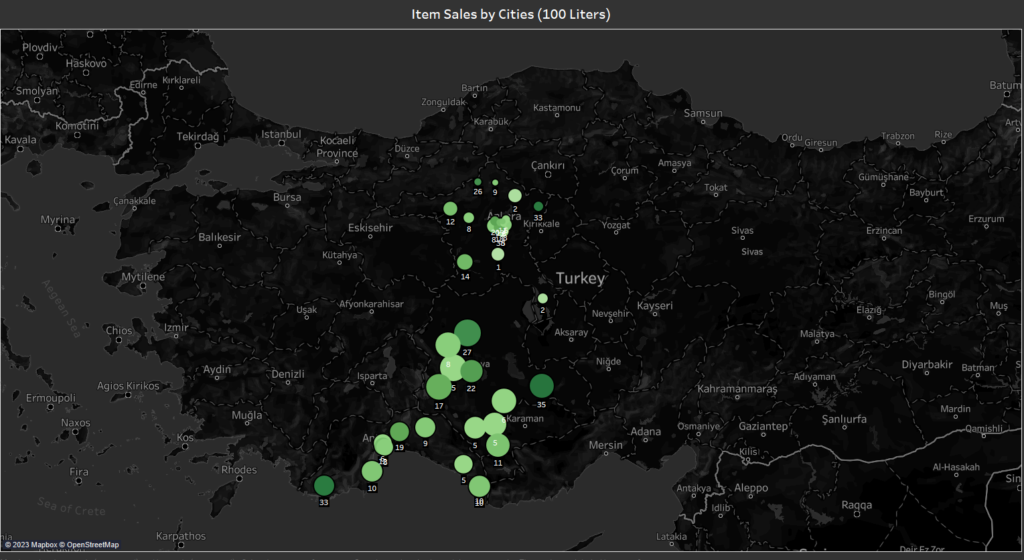
In the first Tableau sheet, we create a map showing regions and cities and the corresponding content sales by category. On the map, we display delivery_zipcode and item_category using “Customer” data. We also filter by region to show where the item was sold the most.
On the second sheet, we display data for item categories and total order amounts per 100 liters. The marks include the item name and the total quantity.
Finally, we display the 10 cities with the highest sales per 100 liters and their postal codes for easy location on the map. Additionally, the amount of 100 liters used is shown.
You can view all sheets on the dashboard below;
This dashboard provides a comprehensive overview of the ingredients that are frequently purchased, segmented by region. It helps in analyzing agricultural market trends, regional preferences, and product demand. This information equips businesses with valuable insights to devise effective marketing strategies for the upcoming summer season and to optimize their inventory based on consumer demand. These insights are a catalyst for informed decision-making based on data, enabling businesses to maintain a competitive edge in the market.
GitHub
Tableau

Kaggle
