Data Related Jobs Salaries for 2022
GOAL
RESULT
PROJECT DURATION
Building a thorough and intuitive Tableau dashboard to examine and display wage data from the global tech sector across a range of criteria, including employment type, experience level, company size, and location.
A Tableau dashboard with a multi-faceted analysis of salary data was successfully created. It contains pie charts showing the salary distribution by company size, a global salary distribution map, salary histograms by employment type and experience level, and an in-depth analysis by job title and experience level.
The estimated duration of the project is 1 to 7 days, depending on the availability, completeness, and cleanliness of the data.
CASE – DATA RELATED JOBS SALARY INSIGHTS
As part of this project, I utilized data from https://www.kaggle.com/datasets/ruchi798/data-science-job-salaries.
You can watch the raw video of this project accelerated 3 times below.
Distribution of Square Meter Living
This project creates a Tableau dashboard that offers a comprehensive look into the pay scales in the global tech industry by utilizing a large dataset. In order to provide a comprehensive picture of the compensation landscape across a range of professional categories, it compares employment and geographic data.
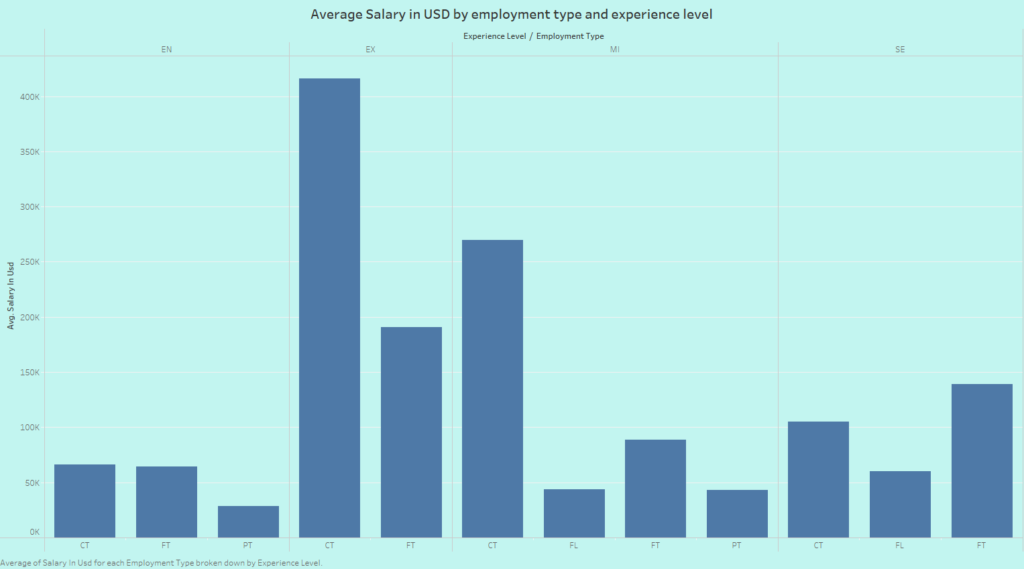
Users can see how payment varies with duration and job structure in detail with the dashboard’s bar chart that breaks down average salaries by full-time, part-time, contract, and freelance work, further segmented by experience level.
Salary Distribution by Employment Type and Experience Level
Users can see how payment varies with duration and job structure in detail with the dashboard’s bar chart that breaks down average salaries by full-time, part-time, contract, and freelance work, further segmented by experience level.

Global Salary Distribution by Location
An interactive world map that shows average salaries in major tech hubs gives users a broad overview of global pay scales and makes it easy to compare salaries by region.

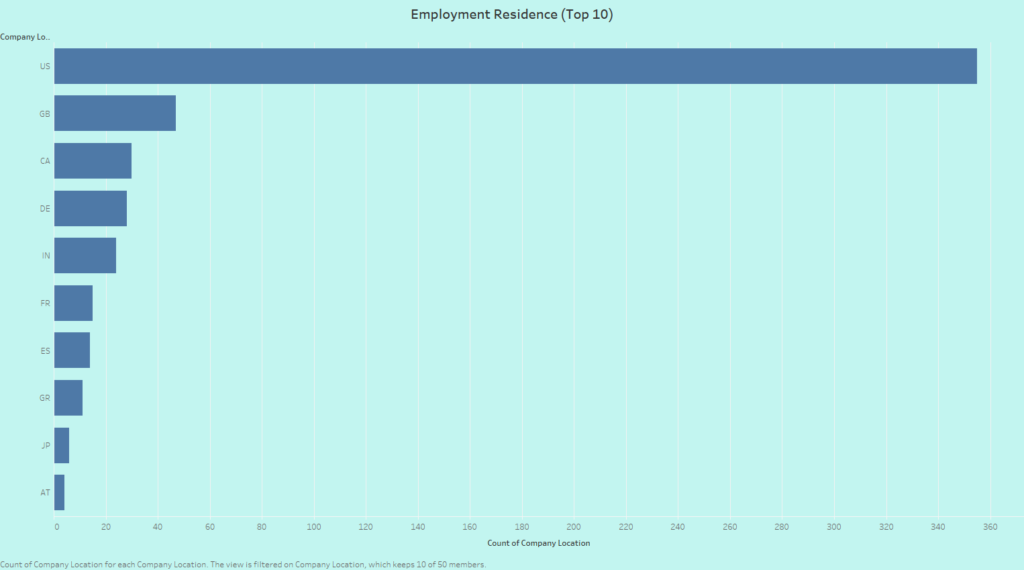
Employment Residence (Top 10)
This horizontal bar chart shows the top 10 countries by employment residence.

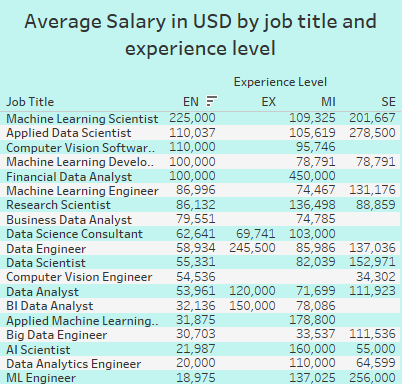
Average Salary in USD by Job Title and Experience Level
This table provides a detailed breakdown of average salaries for data related job titles at different experience levels (Entry, Mid, Senior, Executive). It gives specific insights into what one might expect to earn in roles ranging from Machine Learning Scientist to BI Data Analyst, with salary figures adjusted for experience.

Conclusin:
The Global Data-Related Job Salary Analysis Dashboard serves as an essential resource for candidates, employers, and industry analysts. It provides an interactive and thorough exploration of salary information, enabling informed decision-making within the technology employment market.
You can access the dataset from https://www.kaggle.com/datasets/ruchi798/data-science-job-salaries.
GitHub
Tableau

Kaggle
