Ethical Marketing AI: Bias & Fairness Analysis in Campaign Targeting
GOAL
RESULT
PROJECT DURATION
The objective of this project was to design an analytical Power BI dashboard that evaluates not only the business performance of AI-driven marketing campaign targeting, but also its ethical and fairness-related impact across customer segments.
The project focuses on a realistic marketing analytics scenario where a company uses an AI-supported campaign targeting model to decide which customers should receive specific campaign offers. Instead of measuring only conversion, revenue, and uplift, the dashboard also investigates whether the model systematically under-targets or excludes certain customer groups.
The main analytical question behind the project is:
“Does an AI-driven marketing targeting model improve conversion while creating unfair outcomes for specific customer segments?”
This project combines two analytical areas:
Marketing Analytics
Campaign performance, conversion rate, uplift, retention, revenue, opt-out behavior, and customer segmentation.
Responsible AI / AI Ethics
False negative risk, false positive share, segment-level exclusion risk, fairness monitoring, and ethical warning indicators.a
The final result is a three-page interactive Power BI dashboard that provides a complete view of campaign performance, segment fairness, and AI model behavior.
The dashboard includes:
- Executive campaign performance overview
- Conversion rate and revenue analysis
- Campaign uplift comparison between targeted and control groups
- Retention and customer risk indicators
- Segment-level fairness analysis by age group and income band
- False negative heatmap
- AI model recommendation vs actual response comparison
- False positive and false negative monitoring
- Risk band distribution
- Ethical warning panel for high-risk customer segments
The dashboard identifies a clear fairness signal: the 55+ age group shows the lowest targeting rate while also showing the highest false negative rate. In addition, low-income customers show higher complaint and opt-out behavior, suggesting that campaign pressure and model underestimation may not be evenly distributed across customer groups.
The project was completed within an estimated time frame of 3 to 5 days.
This included:
- Designing the project scenario
- Creating a realistic synthetic marketing campaign dataset
- Preparing the CSV file for Power BI compatibility
- Importing and validating data types in Power BI
- Creating DAX measures
- Building three dashboard pages
- Designing fairness-focused visuals
- Adding risk watchlists and ethical warning panels
- Preparing the project for portfolio presentation
CASE – ETHICAL MARKETING AI TARGETING DASHBOARD
In this project, I created a Power BI dashboard to analyze the performance and fairness of an AI-driven marketing campaign targeting model.
The scenario is based on a company that uses an AI model to decide which customers should receive campaign offers. The model assigns a predicted score to customers, recommends targeting decisions, and produces campaign outcomes such as conversion, retention, revenue, complaint behavior, opt-out behavior, and false positive / false negative flags.
The aim was not only to answer whether the campaign model performs well, but also whether its performance comes with ethical risks.
A traditional marketing dashboard might stop at conversion rate, revenue, and campaign uplift. This project goes further by asking:
- Which customer groups are targeted more often?
- Which customer groups are under-targeted?
- Are some customer segments more likely to be false negatives?
- Do complaint and opt-out patterns increase in specific income groups?
- Does the model behave differently across age, income, and region?
- Can we create an early warning panel for ethical marketing risk?
Business Problem
AI-based marketing targeting systems are increasingly used to automate campaign decisions. These systems can improve business performance by identifying customers who are more likely to convert. However, if the model is not monitored carefully, it may create unfair or harmful outcomes.
For example:
- Some customer groups may be systematically excluded from offers.
- Some groups may receive too much campaign pressure.
- Older customers may be underestimated by the model.
- Lower-income groups may show higher opt-out or complaint behavior.
- High conversion performance may hide fairness problems.
This project was designed to explore this trade-off between campaign performance and ethical marketing responsibility.
The main business problem is:
How can a marketing analytics team evaluate whether an AI targeting model improves campaign performance without creating unfair treatment across customer segments?Dataset Creation
Dataset Creation
Since real customer-level marketing data is private and sensitive, I created a realistic synthetic dataset containing 10,000 campaign interactions.
The dataset was designed to look and behave like real CRM / marketing campaign data rather than random artificial data. It includes customer demographics, campaign details, AI model scores, targeting decisions, actual response behavior, revenue, retention, and ethical risk flags.
The dataset includes the following fields:
- interaction_id
- customer_id
- campaign_id
- campaign_name
- campaign_date
- campaign_month
- age_group
- region
- income_band
- city_tier
- lifecycle_stage
- loyalty_tier
- customer_tenure_months
- days_since_last_purchase
- purchase_frequency_12m
- total_spend_12m
- avg_order_value
- previous_purchase
- device_type
- email_consent
- sms_consent
- push_consent
- marketing_eligible
- campaign_channel
- offer_type
- offer_value_pct
- product_category
- historical_open_rate
- historical_click_rate
- engagement_score
- model_version
- targeting_threshold
- predicted_score
- model_recommendation
- targeted_flag
- control_group
- actual_response_probability
- actual_response
- conversion
- revenue
- gross_margin_pct
- retention_30d
- retention_90d
- complaint_flag
- opt_out_flag
- unsubscribe_flag
- false_positive_flag
- false_negative_flag
- risk_band
The final dataset was exported as a Power BI-safe CSV file using:
- Semicolon delimiter
- Dot decimal separator
- ISO date format
- UTF-8 encoding
This was necessary because Power BI can misread decimal values when regional settings differ between Mac, Windows, and European CSV formats.
Synthetic Dataset Generation
The dataset was generated with controlled probability logic to create realistic business behavior.
The first version of the dataset produced an unrealistically high conversion rate. After reviewing the KPI outputs in Power BI, I regenerated the dataset with more realistic marketing campaign assumptions.
The final version of the dataset produced the following approximate KPI profile:
| KPI | Value |
|---|---|
| Total interactions | 10,000 |
| Unique customers | 4,445 |
| Targeting rate | 46.00% |
| Overall conversion rate | 18.68% |
| Targeted conversion rate | 27.67% |
| Control conversion rate | 11.02% |
| Campaign uplift | 16.66 percentage points |
| Complaint rate | 2.18% |
| Opt-out rate | 2.96% |
| Retention 30D rate | 60.09% |
| Retention 90D rate | 49.36% |
| False negative rate | 7.22% |
| Total revenue | 90.67K |
These values were intentionally designed to be realistic for a marketing analytics case study. The dashboard therefore avoids exaggerated results and presents a more credible business scenario.
Python Code for Dataset Generation
The dataset was generated in Python using structured probability logic. The purpose was not to create random rows, but to simulate a realistic customer-level marketing campaign environment.
Below is a simplified version of the dataset generation logic used for this project.
import numpy as np
import pandas as pd
from datetime import datetime, timedelta

np.random.seed(42)

n = 10000

age_groups = ["18-24", "25-34", "35-44", "45-54", "55+"]
regions = ["North", "South", "East", "West", "Central"]
income_bands = ["Low", "Medium", "High"]
channels = ["Email", "SMS", "App Push", "Paid Social"]
campaigns = [
    "New Year Retention",
    "Winter Clearance",
    "Loyalty Boost",
    "Spring Bundle",
    "Midyear Discount",
    "Premium Upgrade"
]

data = []

for i in range(1, n + 1):
    age_group = np.random.choice(
        age_groups,
        p=[0.16, 0.25, 0.25, 0.20, 0.14]
    )

    region = np.random.choice(regions)
    income_band = np.random.choice(
        income_bands,
        p=[0.38, 0.42, 0.20]
    )

    campaign_name = np.random.choice(campaigns)
    campaign_channel = np.random.choice(
        channels,
        p=[0.36, 0.18, 0.30, 0.16]
    )

    previous_purchase = np.random.binomial(1, 0.72)
    purchase_frequency_12m = np.random.poisson(2.8)
    avg_order_value = round(np.random.uniform(18, 95), 2)
    total_spend_12m = round(avg_order_value * purchase_frequency_12m, 2)

    historical_open_rate = round(np.random.uniform(0.10, 0.55), 3)
    historical_click_rate = round(np.random.uniform(0.02, 0.28), 3)

    engagement_score = round(
        (historical_open_rate * 0.45)
        + (historical_click_rate * 0.35)
        + (previous_purchase * 0.20),
        3
    )

    # Age and income effects are intentionally included
    # to create realistic fairness monitoring patterns.
    age_effect = {
        "18-24": 0.02,
        "25-34": 0.04,
        "35-44": 0.05,
        "45-54": 0.02,
        "55+": -0.08
    }[age_group]

    income_effect = {
        "Low": -0.03,
        "Medium": 0.02,
        "High": 0.05
    }[income_band]

    channel_effect = {
        "Email": 0.04,
        "App Push": 0.03,
        "Paid Social": 0.02,
        "SMS": -0.01
    }[campaign_channel]

    predicted_score = round(
        np.clip(
            0.45
            + engagement_score * 0.35
            + age_effect
            + income_effect
            + channel_effect
            + np.random.normal(0, 0.07),
            0.01,
            0.99
        ),
        3
    )

    targeting_threshold = 0.60
    model_recommendation = int(predicted_score >= targeting_threshold)

    # Not every recommended customer is targeted.
    # This simulates campaign capacity, control groups, and eligibility rules.
    marketing_eligible = np.random.binomial(1, 0.90)
    control_group = np.random.binomial(1, 0.15)

    targeted_flag = int(
        model_recommendation == 1
        and marketing_eligible == 1
        and control_group == 0
        and np.random.random() < 0.78
    )

    base_response_probability = (
        0.08
        + previous_purchase * 0.05
        + engagement_score * 0.18
        + targeted_flag * 0.12
        + channel_effect
        + np.random.normal(0, 0.035)
    )

    # Older customers are intentionally modeled with response potential
    # that the AI model sometimes underestimates.
    if age_group == "55+":
        base_response_probability += 0.035

    actual_response_probability = round(
        np.clip(base_response_probability, 0.01, 0.65),
        3
    )

    actual_response = np.random.binomial(1, actual_response_probability)
    conversion = actual_response

    revenue = round(conversion * np.random.uniform(22, 140), 2)
    gross_margin_pct = round(np.random.uniform(0.15, 0.52), 3)

    retention_30d = np.random.binomial(
        1,
        np.clip(0.56 + conversion * 0.10, 0, 1)
    )

    retention_90d = np.random.binomial(
        1,
        np.clip(0.45 + conversion * 0.08, 0, 1)
    )

    complaint_probability = 0.012
    opt_out_probability = 0.018

    if income_band == "Low":
        complaint_probability += 0.014
        opt_out_probability += 0.018

    if campaign_channel == "SMS":
        complaint_probability += 0.008
        opt_out_probability += 0.012

    complaint_flag = np.random.binomial(1, complaint_probability)
    opt_out_flag = np.random.binomial(1, opt_out_probability)
    unsubscribe_flag = np.random.binomial(1, opt_out_probability * 0.50)

    false_positive_flag = int(model_recommendation == 1 and actual_response == 0)
    false_negative_flag = int(model_recommendation == 0 and actual_response == 1)

    if false_negative_flag == 1 and age_group == "55+":
        risk_band = np.random.choice(["High", "Critical"], p=[0.78, 0.22])
    elif complaint_flag == 1 or opt_out_flag == 1:
        risk_band = np.random.choice(["Medium", "High"], p=[0.72, 0.28])
    else:
        risk_band = np.random.choice(["Low", "Medium"], p=[0.78, 0.22])

    campaign_date = datetime(2025, 1, 1) + timedelta(days=np.random.randint(0, 181))
    campaign_month = campaign_date.replace(day=1)

    data.append({
        "interaction_id": f"INT_{i:06d}",
        "customer_id": f"CUST_{np.random.randint(1, 4500):05d}",
        "campaign_id": f"CAMP_2025_{campaign_date.month:02d}",
        "campaign_name": campaign_name,
        "campaign_date": campaign_date.strftime("%Y-%m-%d"),
        "campaign_month": campaign_month.strftime("%Y-%m-%d"),
        "age_group": age_group,
        "region": region,
        "income_band": income_band,
        "campaign_channel": campaign_channel,
        "previous_purchase": previous_purchase,
        "purchase_frequency_12m": purchase_frequency_12m,
        "total_spend_12m": total_spend_12m,
        "avg_order_value": avg_order_value,
        "historical_open_rate": historical_open_rate,
        "historical_click_rate": historical_click_rate,
        "engagement_score": engagement_score,
        "model_version": "MKT_AI_v2.3",
        "targeting_threshold": targeting_threshold,
        "predicted_score": predicted_score,
        "model_recommendation": model_recommendation,
        "targeted_flag": targeted_flag,
        "control_group": control_group,
        "actual_response_probability": actual_response_probability,
        "actual_response": actual_response,
        "conversion": conversion,
        "revenue": revenue,
        "gross_margin_pct": gross_margin_pct,
        "retention_30d": retention_30d,
        "retention_90d": retention_90d,
        "complaint_flag": complaint_flag,
        "opt_out_flag": opt_out_flag,
        "unsubscribe_flag": unsubscribe_flag,
        "false_positive_flag": false_positive_flag,
        "false_negative_flag": false_negative_flag,
        "risk_band": risk_band
    })

df = pd.DataFrame(data)

df.to_csv(
    "ethical_marketing_ai_campaign_dataset_10000_PowerBI_SAFE_v2.csv",
    sep=";",
    index=False,
    encoding="utf-8-sig"
)
This script created a controlled synthetic dataset where performance and fairness risks could be tested inside a dashboard environment.
The most important design choice was to make the dataset realistic enough for a marketing analytics portfolio project while still allowing ethical patterns to appear clearly in the dashboard.
Power BI Data Model
The project uses a single fact table:
Fact_AI_Marketing_TargetingThe table contains one row per campaign interaction.
The model was intentionally kept simple for portfolio clarity. Instead of building a complex star schema, the project focuses on demonstrating:
- DAX measure creation
- campaign performance analysis
- AI model evaluation
- fairness monitoring
- segment-level risk reporting
The dashboard pages are built directly on top of the campaign interaction table.
DAX Measures
The Power BI dashboard uses DAX measures to calculate campaign performance, targeting behavior, retention, model accuracy, and fairness indicators.
Below are the key DAX measures used in the project.
Total Interactions Total Interactions = COUNTROWS(Fact_AI_Marketing_Targeting)Total Customers
Total Customers = DISTINCTCOUNT(Fact_AI_Marketing_Targeting[customer_id])Total Revenue
Total Revenue = SUM(Fact_AI_Marketing_Targeting[revenue])Conversions
Conversions = SUM(Fact_AI_Marketing_Targeting[conversion])Conversion Rate
Conversion Rate = DIVIDE( [Conversions], [Total Interactions] )Targeting Rate
Targeting Rate = DIVIDE( SUM(Fact_AI_Marketing_Targeting[targeted_flag]), [Total Interactions] )Complaint Rate
Complaint Rate = DIVIDE( SUM(Fact_AI_Marketing_Targeting[complaint_flag]), [Total Interactions] )Opt-out Rate
Opt-out Rate = DIVIDE( SUM(Fact_AI_Marketing_Targeting[opt_out_flag]), [Total Interactions] )Targeted Conversion Rate
Targeted Conversion Rate = CALCULATE( AVERAGE(Fact_AI_Marketing_Targeting[conversion]), Fact_AI_Marketing_Targeting[targeted_flag] = 1 )Control Conversion Rate
Control Conversion Rate =
CALCULATE(
    AVERAGE(Fact_AI_Marketing_Targeting[conversion]),
    Fact_AI_Marketing_Targeting[control_group] = 1
)
Retention 30D Rate
Retention 90D Rate = AVERAGE(Fact_AI_Marketing_Targeting[retention_90d])False Negative Rate
False Negative Rate = AVERAGE(Fact_AI_Marketing_Targeting[false_negative_flag])False Positive Share
False Positive Share = AVERAGE(Fact_AI_Marketing_Targeting[false_positive_flag])Average Predicted Score
Average Predicted Score = AVERAGE(Fact_AI_Marketing_Targeting[predicted_score])Model Recommendation Rate
Model Recommendation Rate = AVERAGE(Fact_AI_Marketing_Targeting[model_recommendation])Actual Response Rate
Actual Response Rate = AVERAGE(Fact_AI_Marketing_Targeting[actual_response])Income Band Sort
Income Band Sort = SWITCH( Fact_AI_Marketing_Targeting[income_band],
"Low", 1, "Medium", 2,"High", 3 )
Dashboard Creation
After preparing the data and building DAX measures, the next step was to design the Power BI dashboard.
The dashboard was divided into three main pages:
- Executive Overview
- Segment Fairness Analysis
- AI Model Performance & Ethical Risk Panel
Each page has a specific analytical purpose.
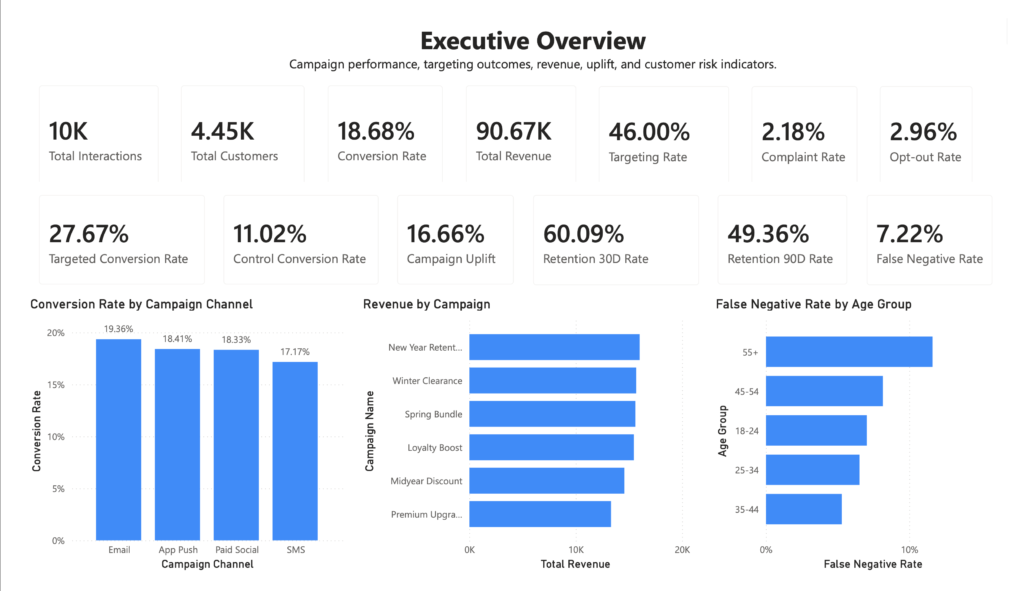
Dashboard Page 1 – Executive Overview
The first page provides a high-level overview of the campaign performance.
It includes the following KPI cards:
- Total Interactions
- Total Customers
- Conversion Rate
- Total Revenue
- Targeting Rate
- Complaint Rate
- Opt-out Rate
- Targeted Conversion Rate
- Control Conversion Rate
- Campaign Uplift
- Retention 30D Rate
- Retention 90D Rate
- False Negative Rate
The page also includes three main visuals:
Conversion Rate by Channel
This visual compares campaign conversion rates across different marketing channels:
- App Push
- Paid Social
- SMS
The result shows that Email performed slightly better than other channels, while SMS produced a lower conversion rate.
Revenue by Campaign
This visual compares total revenue across campaign types such as:
- New Year Retention
- Winter Clearance
- Spring Bundle
- Loyalty Boost
- Midyear Discount
- Premium Upgrade
The purpose of this visual is to compare business value across campaign strategies.
False Negative Rate by Age
This visual introduces the ethical monitoring component of the project. It shows that false negative risk is not equally distributed across age groups. The 55+ group appears as the highest-risk group in terms of false negatives.
This is important because false negatives represent customers who may have had response potential but were not recommended by the model.
Dashboard Page 2 – Segment Fairness Analysis
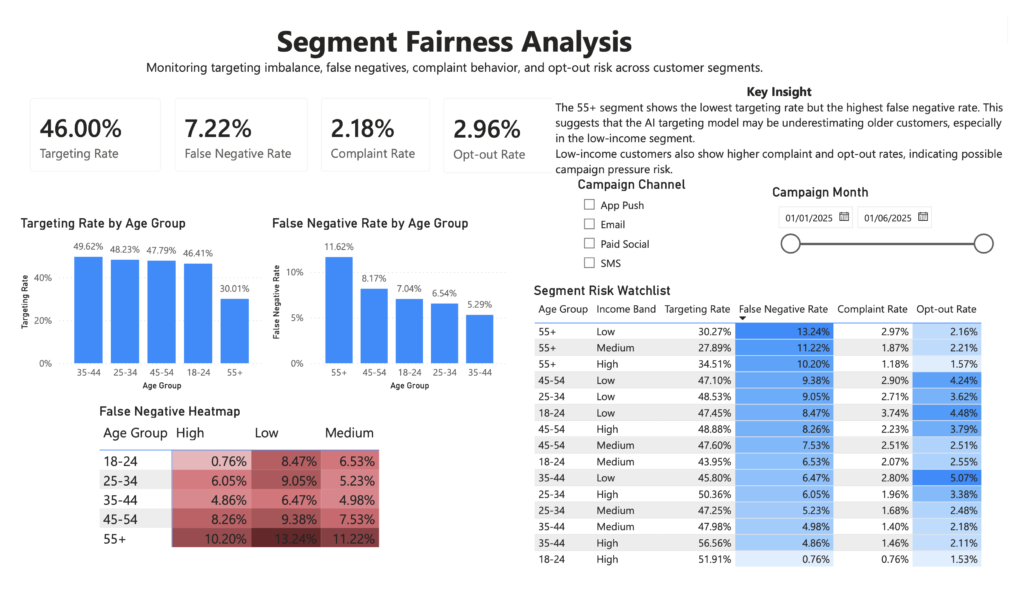
The second page focuses on fairness and segment-level risk.
It includes four KPI cards:
- Targeting Rate
- False Negative Rate
- Complaint Rate
- Opt-out Rate
These indicators summarize whether campaign targeting and customer response risks are evenly distributed.
The page includes the following visuals:
Targeting Rate by Age Group
This chart shows which age groups are more or less likely to be targeted.
The strongest signal is that the 55+ group has the lowest targeting rate, around 30%, while other age groups are targeted at higher levels.
This suggests a possible under-targeting issue.
False Negative Rate by Age Group
This chart shows that the 55+ group has the highest false negative rate.
This is an important fairness risk because it means older customers are more likely to be missed by the AI model, even when they may have actual response potential.
False Negative Heatmap
The heatmap compares false negative rate across age groups and income bands.
The highest-risk segment is:
55+ / Low incomeThis group shows the highest false negative rate in the matrix.
The heatmap helps identify where fairness risk is concentrated instead of looking only at general averages.
Segment Risk Watchlist
The Segment Risk Watchlist is a table that ranks customer segments by risk indicators.
It includes:
- Age Group
- Income Band
- Targeting Rate
- False Negative Rate
- Complaint Rate
- Opt-out Rate
Conditional formatting is applied to highlight high-risk values.
The table functions as an operational monitoring tool for marketing and responsible AI teams.
Interactive Filters
The page includes slicers for:
- Campaign Channel
- Campaign Month
These filters allow users to inspect whether fairness patterns change by campaign channel or campaign period.
Dashboard Page 3 – AI Model Performance & Ethical Risk Panel
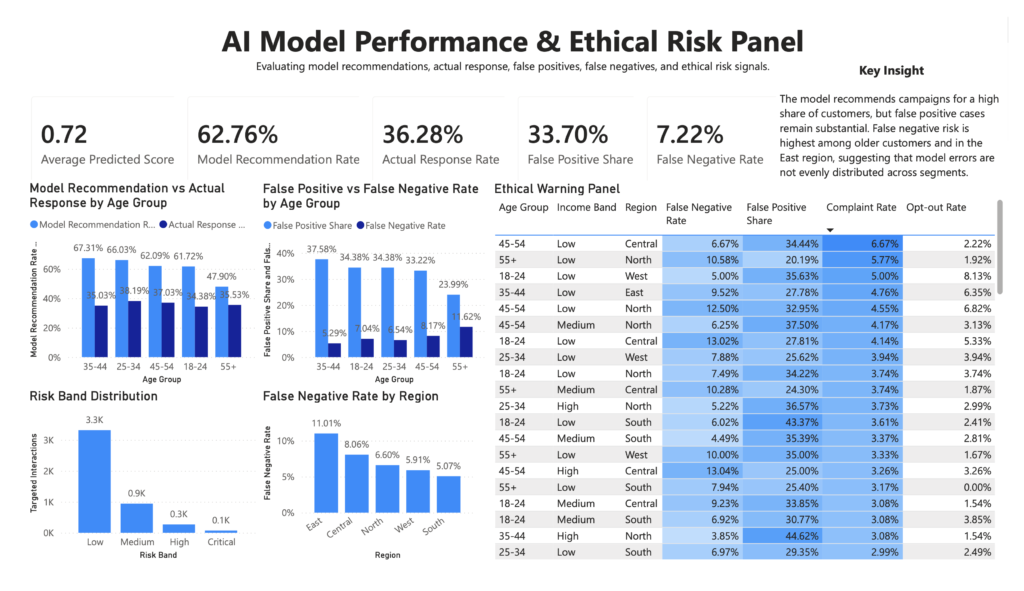
The third page focuses on AI model behavior and ethical warning signals.
It includes five KPI cards:
- Average Predicted Score
- Model Recommendation Rate
- Actual Response Rate
- False Positive Share
- False Negative Rate
These metrics summarize how the AI model behaves compared to actual customer responses.
Model Recommendation vs Actual Response by Age Group
This visual compares the percentage of model recommendations against actual customer response rate by age group.
The visual shows that the model recommends campaigns to a high share of customers, but actual response is lower.
This helps identify gaps between model decision-making and real customer behavior.
False Positive vs False Negative by Age Group
This visual compares two types of model errors:
False positives:
Customers recommended by the model but not responding.
False negatives:
Customers not recommended by the model but showing actual positive response.
This is one of the key visuals for model monitoring.
Risk Band Distribution
This chart shows the distribution of interactions across risk bands:
- Low
- Medium
- High
- Critical
Most interactions fall into the Low risk band, while smaller groups appear in Medium, High, and Critical categories.
This helps communicate the overall risk profile of the campaign targeting system.
False Negative Rate by Region
This visual compares false negative rates across regions.
The East region shows the highest false negative rate, suggesting that model errors may also vary geographically.
Ethical Warning Panel
The Ethical Warning Panel is a table designed to highlight high-risk customer segments.
It includes:
- Age Group
- Income Band
- Region
- False Negative Rate
- False Positive Share
- Complaint Rate
- Opt-out Rate
Conditional formatting is used to highlight elevated risk values.
The purpose of this panel is to create an early warning mechanism for responsible marketing decision-making.
Key Insights
Several important insights emerged from the dashboard:
1. Campaign performance is positive but not enough on its own
The dashboard shows a realistic overall conversion rate of 18.68%, with targeted conversion rate reaching 27.67% compared to 11.02% in the control group.
This produces a campaign uplift of 16.66 percentage points.
From a business perspective, the AI-supported targeting model appears useful.
2. The 55+ age group shows potential under-targeting
The 55+ group has the lowest targeting rate and the highest false negative rate.
This suggests that the model may underestimate older customers and exclude them from campaign opportunities despite their response potential.
3. Low-income customers show stronger risk signals
Low-income segments show higher complaint and opt-out patterns.
This may indicate greater sensitivity to campaign pressure or less tolerance for frequent marketing contact.
4. False negative risk is concentrated in specific segments
The false negative heatmap shows that risk is not evenly distributed.
The strongest risk appears among 55+ low-income customers.
5. AI model performance and fairness must be monitored together
The dashboard shows that campaign uplift and conversion rates can look positive at the aggregate level while fairness risks remain visible at the segment level.
This is the central message of the project.
Tools Used
The project was built using the following tools:
- Power BI Desktop
- Power Query
- DAX
- Python
- Pandas
- NumPy
- CSV data preparation
- Synthetic data generation
- Marketing analytics logic
- Responsible AI / fairness analysis concepts
Data Source
The dataset used in this project is synthetic and was created specifically for this portfolio case study.
It does not include real customer data or personally identifiable information.
The dataset was designed to simulate a realistic AI-supported marketing campaign environment, including customer demographics, campaign behavior, model scores, targeting decisions, conversion outcomes, complaint behavior, opt-out behavior, and fairness-related risk indicators.
This approach allowed the project to demonstrate customer analytics and responsible AI monitoring without exposing real user data.
How to Use the Dashboard
Users can explore the dashboard by navigating through the three pages:
1. Executive Overview
Use this page to understand campaign-level performance.
It answers:
- How many interactions were analyzed?
- What is the overall conversion rate?
- How much revenue was generated?
- What is the campaign uplift?
- How do retention and false negative rates look at a high level?
2. Segment Fairness Analysis
Use this page to investigate whether the AI targeting model treats customer segments differently.
It answers:
- Which age groups are targeted less often?
- Which groups have higher false negative rates?
- Which income bands show higher complaint or opt-out behavior?
- Which age-income combinations are most at risk?
3. AI Model Performance & Ethical Risk Panel
Use this page to evaluate model behavior and identify risk signals.
It answers:
- How often does the model recommend targeting?
- How does model recommendation compare to actual response?
- Where are false positives and false negatives concentrated?
- Which segments appear in the ethical warning panel?
Conclusion
The Ethical Marketing AI dashboard demonstrates how marketing analytics can be extended beyond standard campaign performance reporting.
The project shows that an AI-driven targeting model can deliver strong business results, including improved conversion and campaign uplift, while still creating fairness risks across customer segments.
The most important finding is that the 55+ customer group appears to be under-targeted and shows the highest false negative rate. This indicates that the model may be missing older customers with meaningful response potential. In addition, low-income customers show higher complaint and opt-out behavior, suggesting a need to monitor campaign pressure more carefully.
This project highlights the importance of combining marketing performance analysis with responsible AI monitoring.
A good AI marketing model should not only maximize conversion. It should also be checked for exclusion, imbalance, customer pressure, and unfair segment-level outcomes.